


The Dashboard is the centralized hub of all the real-time statistical data collected and monitored in the Agent Workspace. This includes information involving shift management, administrator/agent activity, cross-channel activity, and brand-wide operations.
To access the dashboard, you must first log into the system. On the main homepage, click on the Dashboard icon on the left side menu:
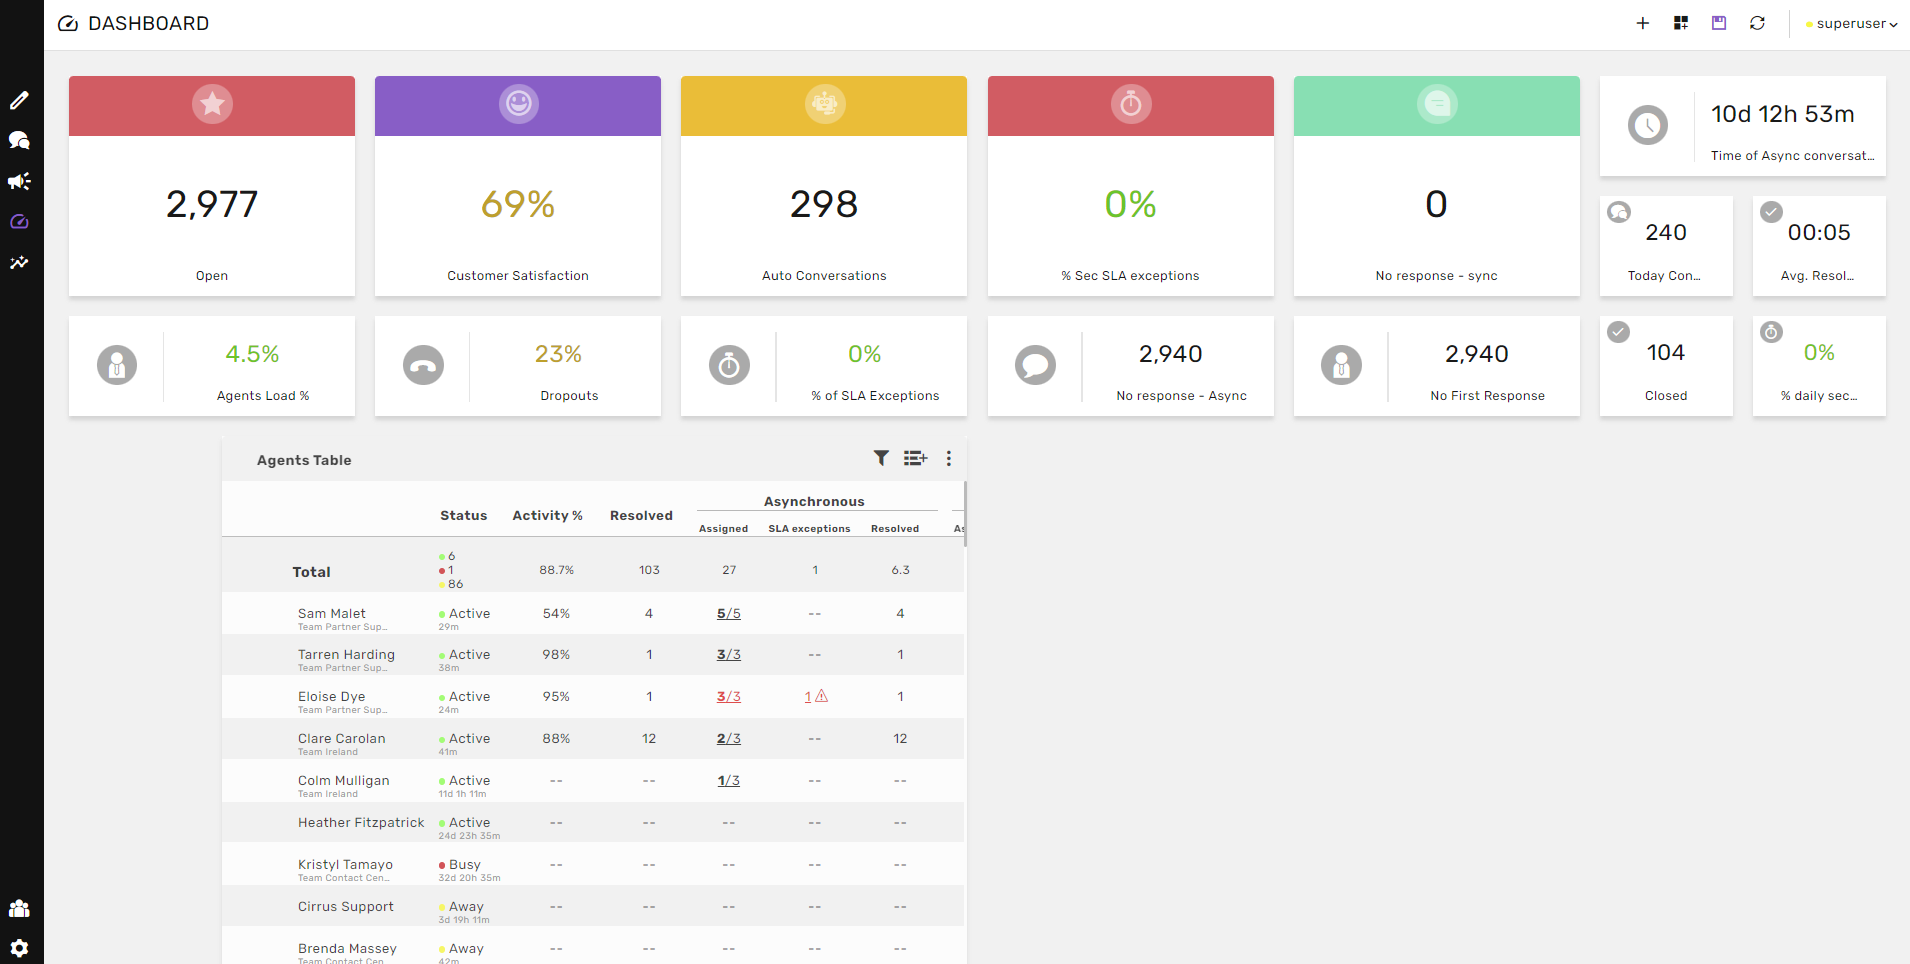
Once you’ve clicked on the Dashboard icon, the screen below appears:
What Are KPIs?
KPIs (Key Performance Indicators) are performance measurements that provide a tool for viewing and monitoring the success of various system operations.
Each brand has a variety of Standard KPIs which can be marked or unmarked and displayed on the Dashboard.
Each KPI is a reflection of a type of activity taking place on a specific channel, subchannel, agent or conversations.
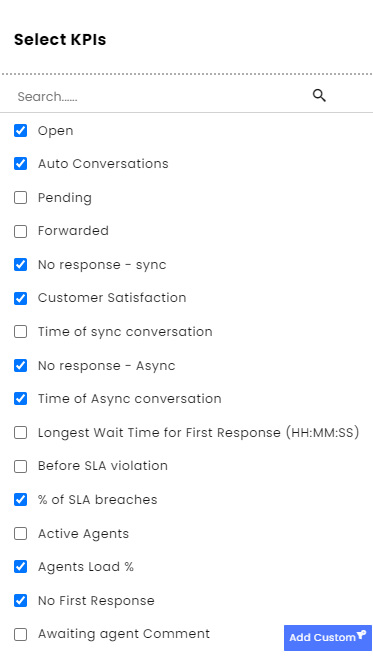
Click on the add metrics icon in the upper corner of the screen:
The list of KPIs appears:
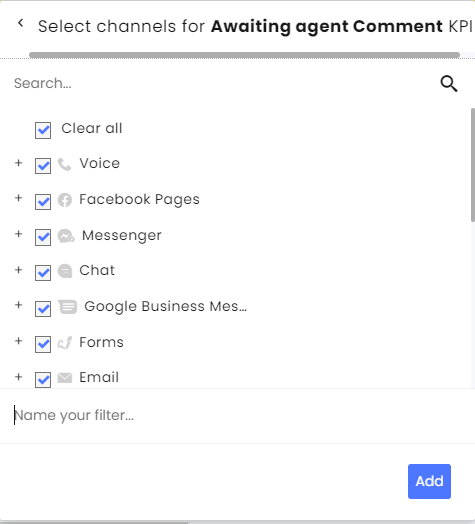
Selecting KPIs and Channels
Select the type of KPI, click Add Custom and select the Channels you wish to apply it to. Once you’re done, name the filter and then click Add:
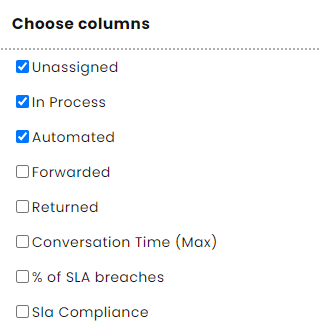
Agents Table
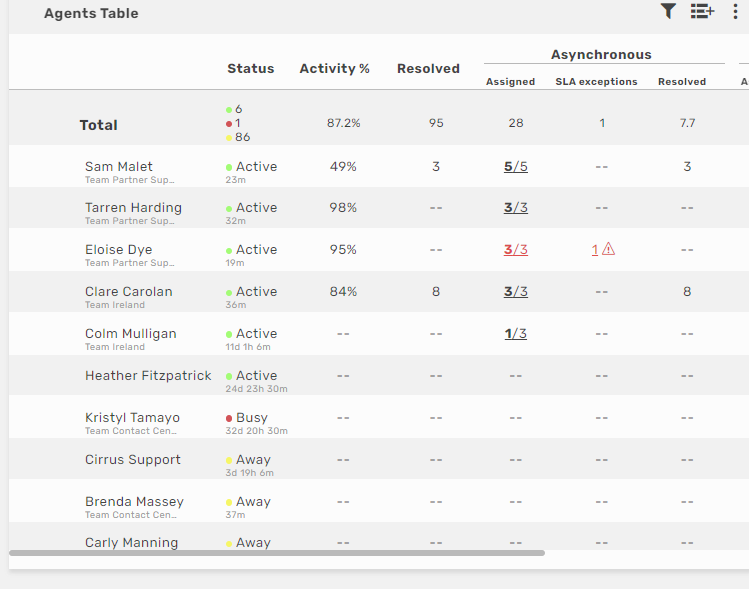
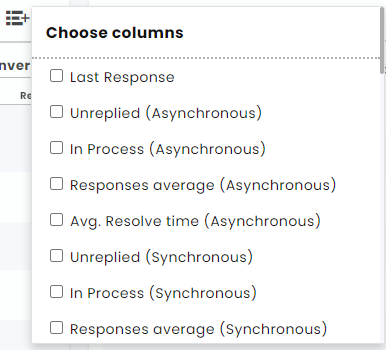
Scroll through the various columns available for selection. Mark or unmark the checkbox next to each option to add or remove it from the Agents Table:
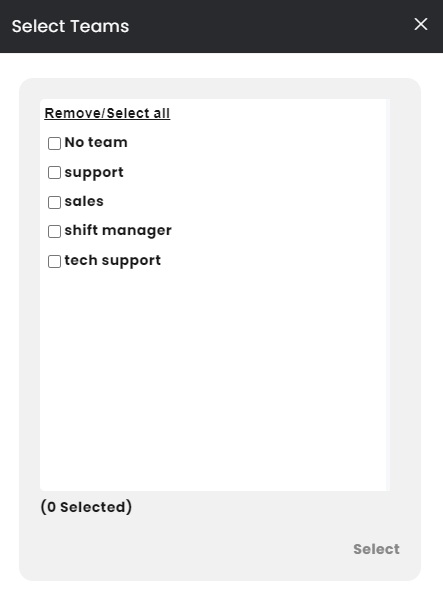
To select which Agents will be displayed, click on the  icon on the right side of the Agents Table header:
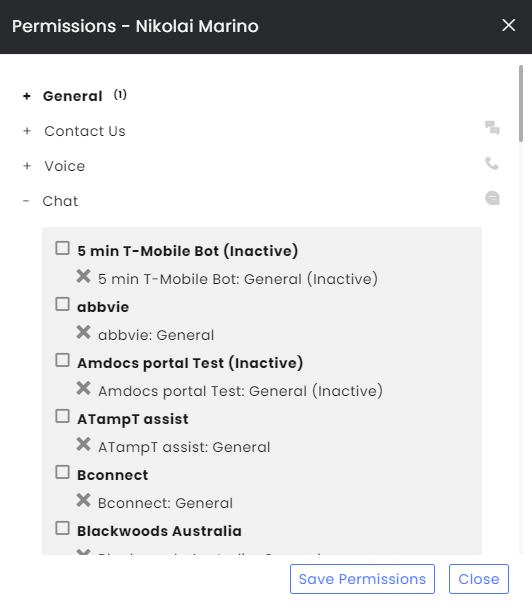
After clicking on the Brain icon, the Permission window appears:
Channels Table
To add or remove columns, click on the icon appearing on the right side of the Channels Table header: